

Finance closes the month with one Trade Spend ROI number. Sales walks into the same meeting with a different one. Both teams pulled from the same deduction data. Neither number is wrong, exactly. They just reflect different points in the processing cycle. But now, no one in the room trusts either figure.
That's the real problem with CPG KPIs at most mid-market brands. The metrics aren't miscalculated. Rather, your most important formulas need fixed inputs, and they don't have them yet. Three things keep the inputs moving: deduction timing lags, distributor portal differences, and PDF-based remittances.
Until the data accuracy problem is solved, your CPG KPIs measure your data infrastructure. They don't measure your business. Fix the foundation, and the metrics become numbers you can actually manage from.
Main Takeaways
- Finance and Sales can pull Trade Spend ROI from the same data at different times and get numbers that contradict each other.
- Deduction timing lags, distributor portal differences, and PDF-based remittances make CPG KPIs unreliable before the data settles.
- At $5M–$50M in revenue, five metrics deserve accurate tracking first: Trade Spend ROI, Gross Margin, Account Profitability, On-Time In-Full (OTIF), and All Commodity Volume (ACV).
- Account Profitability only works if your deduction data is clean at the retailer level. Without that, you can't spot negative-margin orders.
- Assigning one team owner per metric removes the confusion of overlapping calculations from different sources.
What CPG KPIs Actually Matter for Finance and Sales?

The CPG KPIs worth tracking fall into five groups: Sales and Profitability, Trade Spend, Retail Execution, Supply Chain, and Marketing. Each metric has a formula, a benchmark range, and a team that owns it. The table below maps all five groups into a single reference.
The "Team Owner" column addresses a reality most mid-market brands live with. Finance and Sales often calculate overlapping metrics from different sources. So, they tend to arrive at different numbers. Assigning one owner per metric removes that confusion once and for all.
The benchmark ranges for logistics KPIs listed below are sourced from RXO's 2026 research. Financial CPG KPI benchmarks reflect directional industry ranges.
Sales, Profitability, and Account-Level Metrics
Gross Sales is the starting point. Gross Margin and Account Profitability are where Finance and Sales teams diverge most. Gross Margin tells you whether your product economics work. Account Profitability shows whether your trade spend generates profit for each retailer.
That distinction matters. Twenty percent of customer orders produce negative margins, according to a KPMG survey. If you're calculating Account Profitability without clean deduction data at the retailer level, you can't identify which orders those are.
Market Share presents a similar challenge. It measures competitive position, but it doesn't tell the whole story. You also need margin metrics. Growing Market Share through unprofitable promotions still hurts your bottom line.
Trade Spend ROI: The KPI Most Mid-Market Brands Get Wrong
Trade Spend ROI measures how much incremental revenue a promotion generated relative to what you spent. To calculate it, use: (Incremental Revenue Tied to Promotion − Trade Spend) ÷ Trade Spend. For example, $500K in incremental promotional revenue against $150K in trade spend gives you ($500K − $150K) ÷ $150K = 2.3x ROI. A healthy target is 3:1 or higher. Anything below 1:1 means the promotion cost more than it generated.
However, the formula only works if the "Trade Spend" denominator reflects actual costs. Yet at most mid-market brands, deductions from UNFI, KeHE, and Kroger arrive weeks or months after a promotion ends. They often come as PDFs that need manual extraction before they can be matched to the original promotion.
As a result, Trade Spend ROI can change between month-end close and the following month's restatement. When that happens, the KPI is measuring your data lag, not your trade effectiveness.
CPG marketing spending reached 19.5% of sales in 2024, according to Cadent Consulting. With nearly one-fifth of revenue invested in promotions, accurate ROI calculations matter. If Trade Spend ROI calculations are inaccurate, your gross-to-net results can be too.
How Dirty Data Breaks Your Most Important CPG KPIs

Measuring CPG KPIs accurately is hard. The underlying data arrives late, in mixed formats, and often locked inside PDFs. Most mid-market brands can't trust their numbers because of three day-to-day realities.
Three Root Causes of Unreliable CPG KPI Data
Deduction timing: Deductions from trade promotions, chargebacks, and billbacks arrive weeks to months after the activity. Your Trade Spend ROI for Q1 is still being restated in Q2. Deductions from UNFI, KeHE, or Kroger haven't all landed yet.
Distributor data format differences: Each distributor delivers remittance and backup data differently. Some use different formats, others different portals, and some different schedules. There's no standard. Those variances can become even more challenging when disruptions occur. When UNFI experienced a cyberattack in June 2025, order and fulfillment data was disrupted entirely. Kroger's portal migration temporarily delayed remittance access. These aren't edge cases. They're the operating environment.
PDF-based reporting: Many deduction backups still arrive as PDFs. They need manual extraction before they can be categorized, matched, or used in any KPI calculation. Until those PDFs are processed, your numbers are incomplete.
According to PwC, 60% of CPG leaders say their financial reporting doesn't match the way their business operates. At mid-market brands, this mismatch often starts with Finance and Sales pulling the same KPI from different data sources. Even when they use the same data, pulling it at different points in the deduction process can lead to different results.
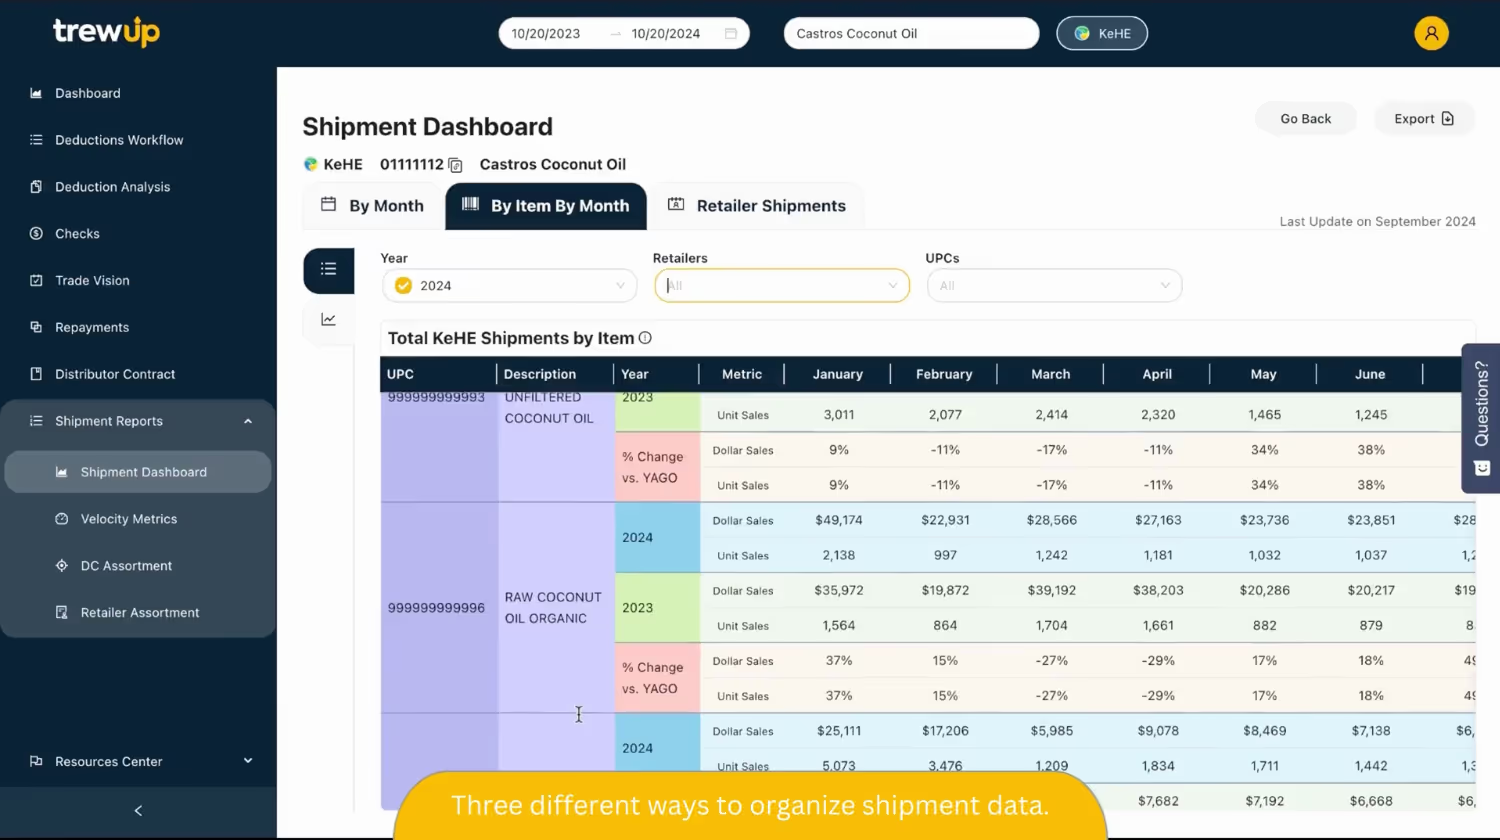
The challenge is common, too. A 2026 RXO study found that 79% of CPG shippers struggle to turn KPI data into useful insights. The problem isn't the KPI. It's that the data isn't complete yet. Platforms like TrewUp connect directly to UNFI, KeHE, and Kroger and use artificial intelligence (AI) to read deduction backups and match each one to the promotion that caused it. The PDF processing lag goes away, and your Trade Spend ROI and Account Profitability calculations rest on actuals instead of estimates.
How Slow Deductions Tie Up Your Cash
Trade Spend ROI and Account Profitability are not the only numbers deductions distort. Slow, unresolved deductions also tie up cash. For a lean finance team, that can be the more urgent problem.
- Open deductions inflate Days Sales Outstanding (DSO). DSO is the average time it takes to collect payment after a sale. When a retailer or distributor takes a deduction, they short-pay the invoice, and it sits as an open item in accounts receivable (AR) until you match and clear it.
- Late, messy data keeps it open longer. Deductions from UNFI, KeHE, and Kroger arrive late and often as PDFs. Every day spent matching them by hand is a day those dollars stay stuck in AR. Across hundreds of open deductions, the trapped cash adds up.
- A higher DSO stretches the whole Cash Conversion Cycle (CCC). CCC measures how long cash is locked in operations before it returns as payment, and DSO is one of its inputs. When deduction lag inflates DSO, your cash comes back slower, even when sales are strong.
Clean, current deduction data shortens the loop. When you can clear a valid deduction or dispute an invalid one in days instead of months, open items resolve faster. DSO falls, cash frees up, and your team spends less time chasing paper.
Which CPG KPIs to Prioritize at $5M–$50M Revenue

If you're a mid-market CPG brand with a lean Finance team, you don't need 14 KPIs. You need four or five that you can calculate accurately and act on every month. Here is The Mid-Market CPG KPI Priority Stack, ordered by impact at the $5M–$50M revenue stage:
- Trade Spend ROI is the single highest-leverage metric. Trade is your largest controllable cost line and the one most distorted by data lags.
- Gross Margin tells you whether your product economics work before trade spend enters the picture.
- Account Profitability tells you whether a retailer relationship earns or burns margin after all deductions, fees, and trade costs are netted out.
- OTIF (On-Time In-Full) is directly tied to retailer scorecards, fines, and slot retention. A lagging OTIF number costs you shelf space.
- ACV (All Commodity Volume) measures distribution reach. At this revenue stage, expanding ACV is typically the primary growth lever.
Enterprise brands track 14+ KPIs because they have dedicated analytics teams. They also have integrated ERP systems and automated data pipelines. At $5M–$50M, you likely have a three-person Finance team reconciling deductions in spreadsheets. Tracking metrics you can't calculate accurately creates false confidence. Start with the five you can trust, then expand as your data infrastructure grows.
RXO's research found that 51% of CPG shippers cite using data to change tactics as their top KPI challenge. Fewer, cleaner KPIs that trigger action beat a dashboard of 15 numbers no one acts on.
Put Your CPG KPI Strategy into Action with TrewUp

You now have formulas, benchmarks, and team ownership mapped across five KPI categories. Trusting the numbers those formulas produce depends on one thing. Your deduction data needs to be clean, current, and consistent across Finance and Sales. We built TrewUp to give you that confidence.
Our platform connects directly to UNFI, KeHE, and Kroger and uses AI to extract, categorize, and match deductions to the promotions behind them. There's no more PDF lag or portal sprawl to break Trade Spend ROI and Account Profitability calculations. Every location executes the same trade activity on time, and you prove it worked with data your leadership team trusts.