









.png)
.png)

.png)
.png)



.png)












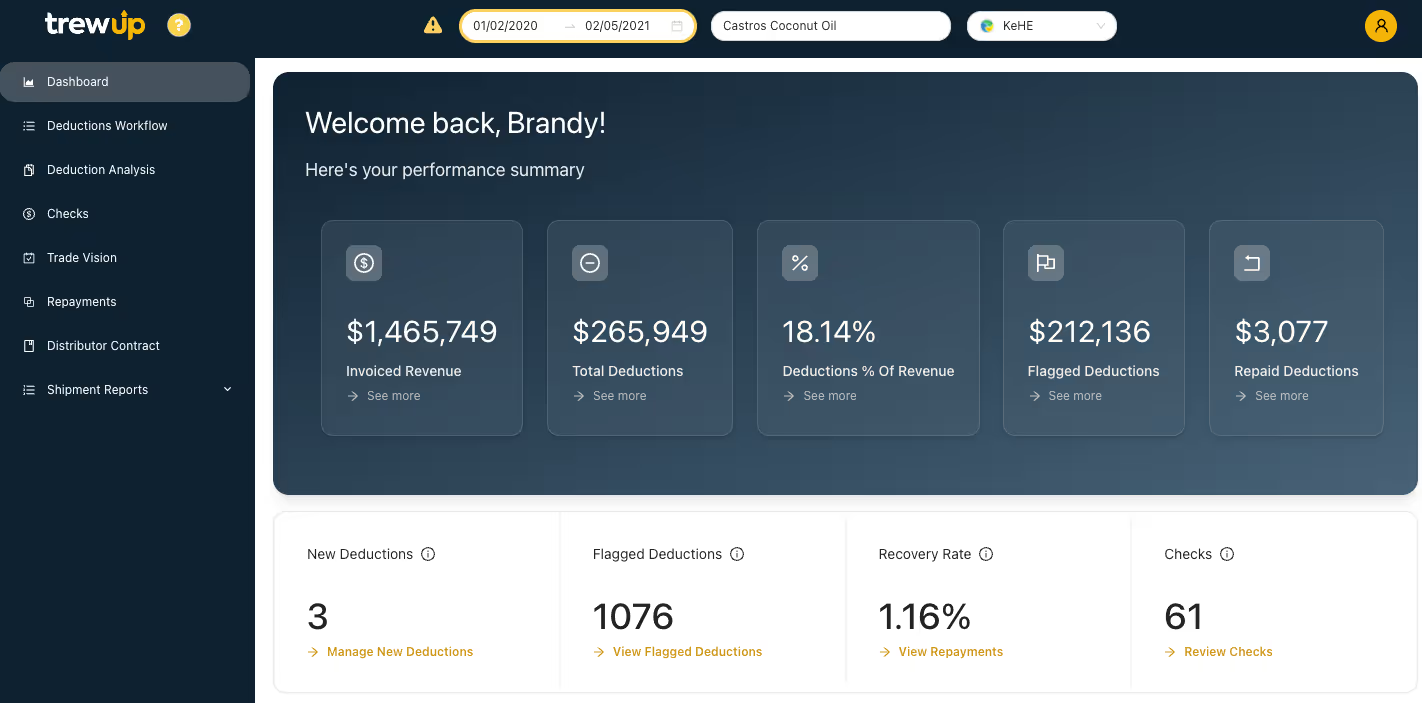
For most CPG brands, POS and shipment data sit in one system and trade spend sits in another. So when a promotion runs, no one can tie the spend to what actually sold through. You end up guessing which retailers and items paid off.
TrewInsights brings both sides together. Your finance and sales teams finally work from the same view of trade performance.

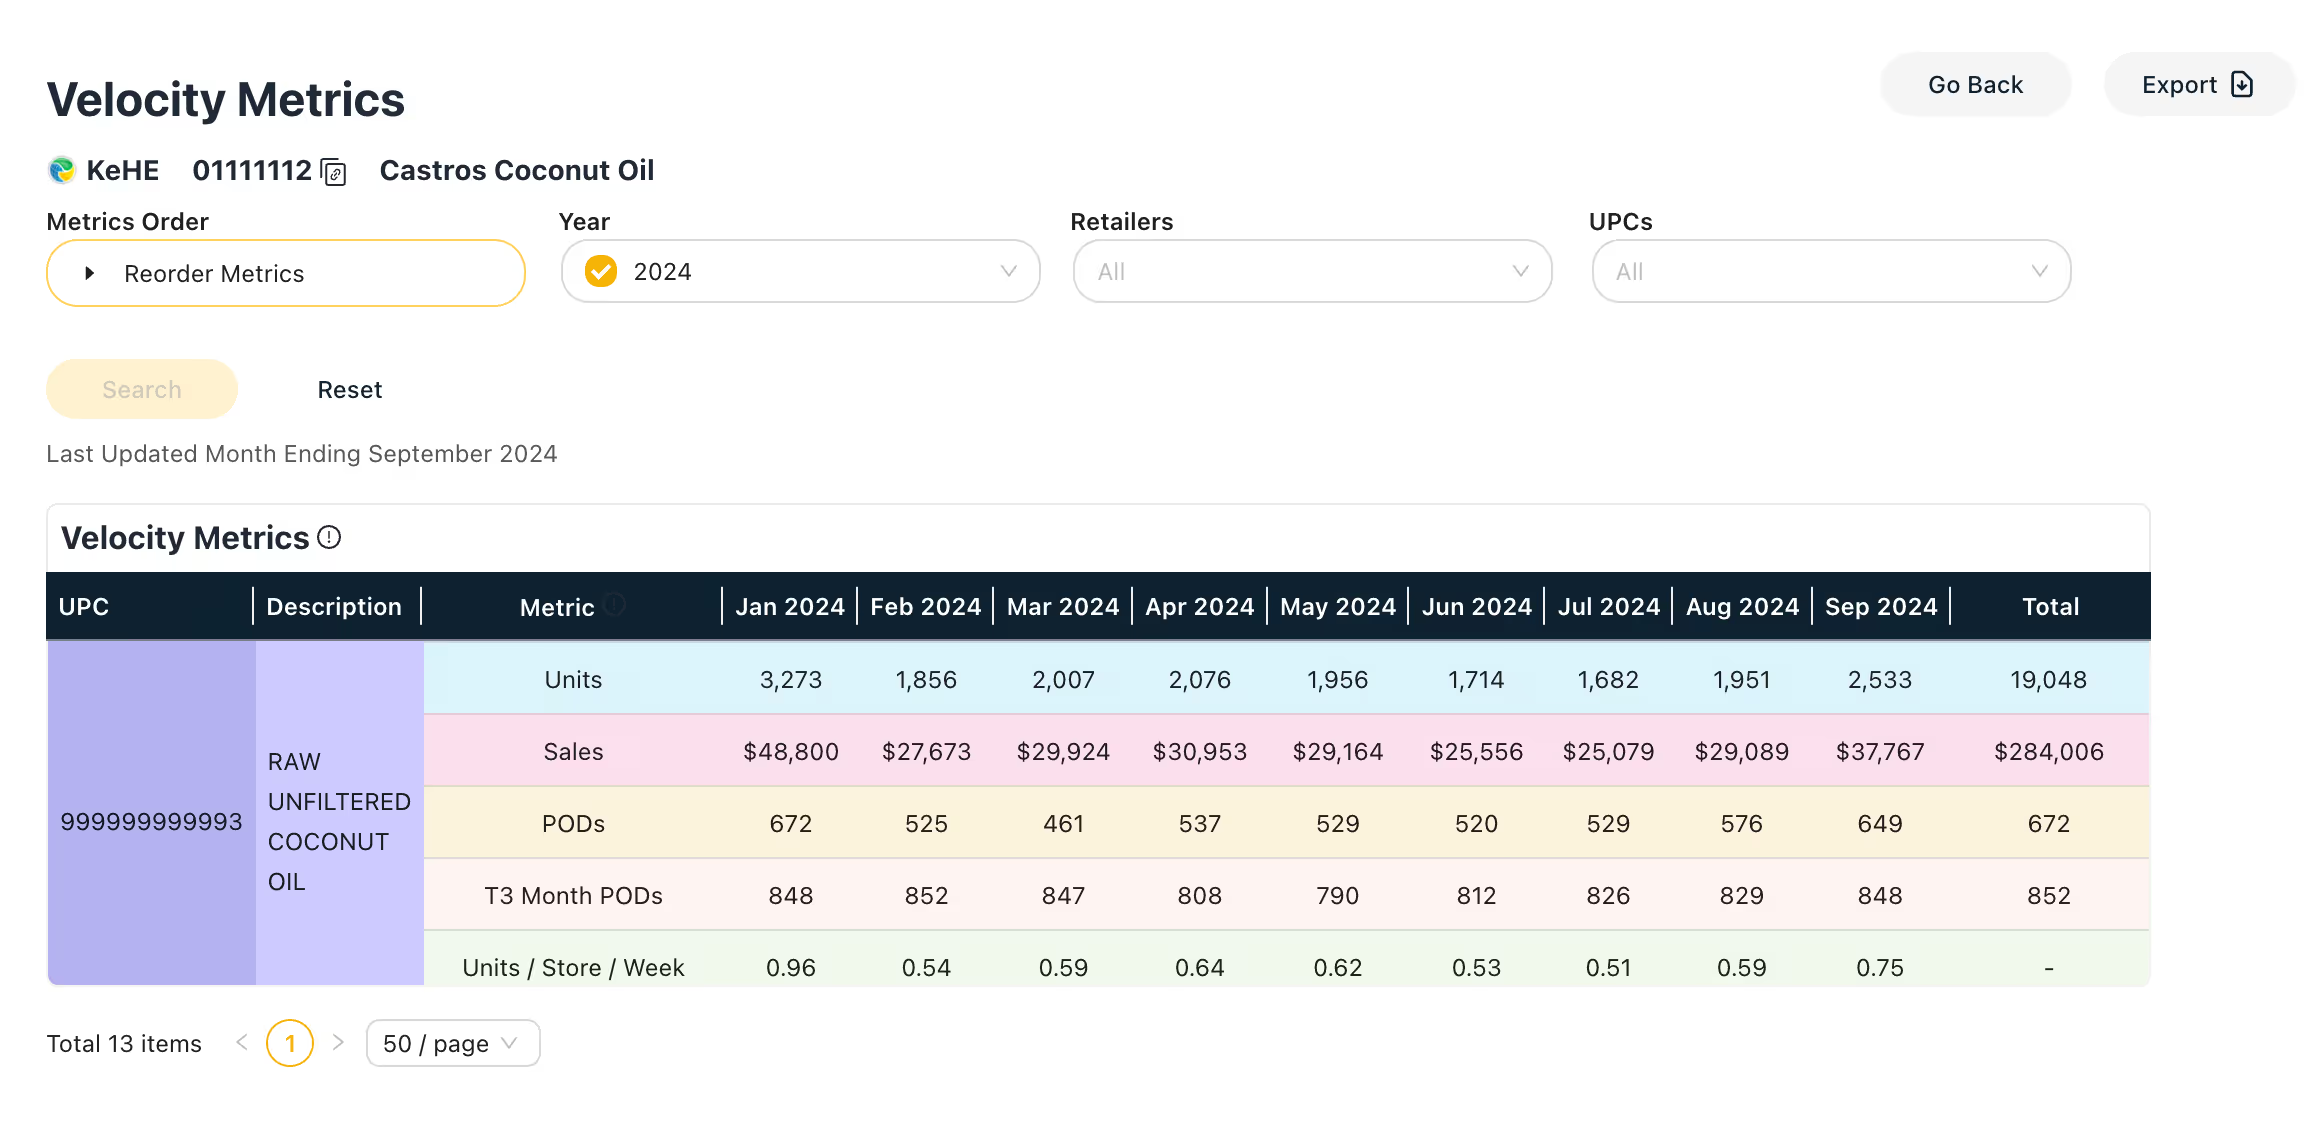
Drill down by retailer, month, and item to see how your products move. Track units per store per week to spot which SKUs have velocity and which are slow. Watch your points of distribution to find where you have shelf presence and where you have gaps.
Connect your trade spend to real sell-through, so you can measure post-promotion performance at the retailer level. See which promotions returned profit and which ones did not. Bring that read into your next plan, instead of waiting until month-end to find out.
Sell-through data shows how many units sold from a store to shoppers. Syndicated data is retail scan data that providers like Circana, NielsenIQ, and SPINS collect and package. Point of sale analytics turn that data into velocity, distribution, and trend views you can act on.

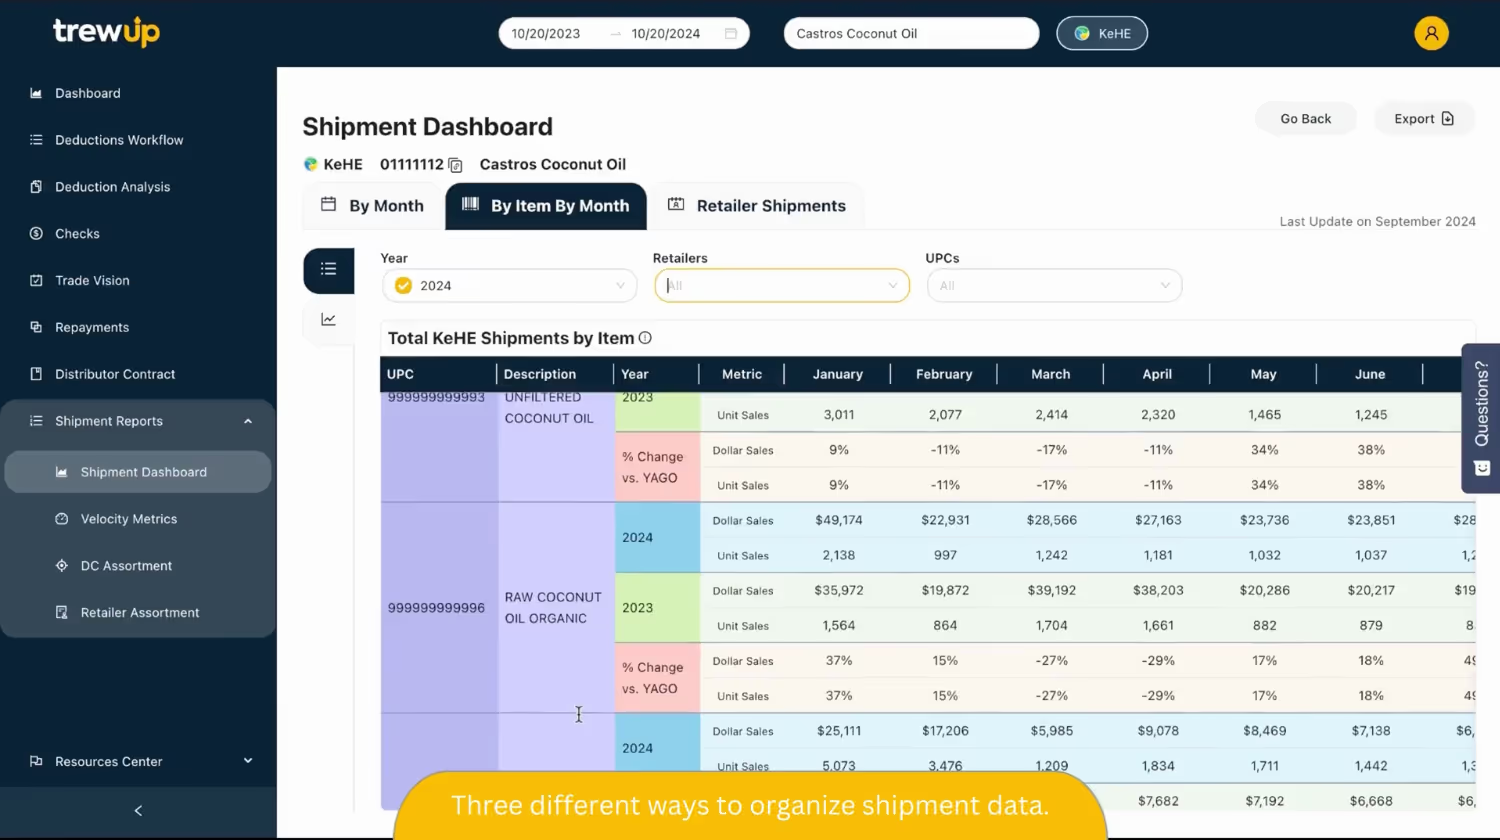
See two years of historical data at a glance. Track total sales from your distributors to retailers at list price, so you can compare this year to last and spot real trends.

Drill down by retailer, month, or item to answer real questions fast. See exactly where your products sell and how each account performs over time.

Measure units per store per week, or UPSPW, by retailer and SKU. Velocity tells you how fast a product moves once it is on the shelf, not just how much shipped.

Monitor where your products sit on the shelf across retailers. Spot distribution gaps early, so your sales team can chase the right accounts before a promotion runs.

TrewInsights is up and running in about two weeks. You start seeing sell-through and trade performance without a long rollout.

You do not need an ERP or a TPM to get started. TrewInsights works on its own.

Prebuilt connections to UNFI, KeHE, and Kroger come standard. Your distributor data flows in, out of the box.

TrewInsights works with the systems you already use. There is nothing to rip out and replace.

Setup does not depend on your IT team. Finance and sales can get going on their own.

Begin with one retailer or a few items, then expand as you go. TrewInsights grows with your brand.
“TrewUp allowed us to optimize our trade spend and sell more product at higher margins! The insights and efficiencies we gained have been invaluable to our sales strategy.”

I would highly recommend any startup company coming to TrewUp. You've been great. I'm always willing to help because the platform has made such a difference for our business.
"It really just simplifies everything for me in a one-stop shop."
“The hours we’ve reclaimed since implementing TrewUp are invaluable. What used to be a time-consuming, manual hunt for discrepancies is now swift and seamless. This software hasn’t just saved us time; it’s transformed the way we manage our finances.”
“The platform empowers us to swiftly identify invalid deductions, and the collaborative features have revolutionized our team’s communication. We can challenge and rectify discrepancies with such ease; it’s truly a game-changer for our operations.”
"This software hasn't just saved us time; it's transformed the way we manage our finances."
“TrewUp allowed us to optimize our trade spend and sell more product at higher margins! The insights and efficiencies we gained have been invaluable to our sales strategy.”
“With TrewUp, we immediately identified $60,000 in incorrect brand name deductions. This tool has been instrumental in ensuring our financial accuracy and instilling confidence in our revenue management.”
"This tool not only helps with getting money back from deductions, but it has informed our sales gaps, demand planning, and sales reporting."
“We’re beyond impressed with the results and the TrewUp Teams’ commitment to creating value and usage for us. We heartily recommend TrewUp to any CPG brand looking to increase efficiency and focus on growth.”
“We can confidently say that TrewUp is a game changer. It’s been a seamless integration with tremendous impact.”
I would highly recommend any startup company coming to TrewUp. You've been great. I'm always willing to help because the platform has made such a difference for our business.
"It really just simplifies everything for me in a one-stop shop."
“The hours we’ve reclaimed since implementing TrewUp are invaluable. What used to be a time-consuming, manual hunt for discrepancies is now swift and seamless. This software hasn’t just saved us time; it’s transformed the way we manage our finances.”
“The platform empowers us to swiftly identify invalid deductions, and the collaborative features have revolutionized our team’s communication. We can challenge and rectify discrepancies with such ease; it’s truly a game-changer for our operations.”
"This software hasn't just saved us time; it's transformed the way we manage our finances."
“TrewUp allowed us to optimize our trade spend and sell more product at higher margins! The insights and efficiencies we gained have been invaluable to our sales strategy.”
“With TrewUp, we immediately identified $60,000 in incorrect brand name deductions. This tool has been instrumental in ensuring our financial accuracy and instilling confidence in our revenue management.”
"This tool not only helps with getting money back from deductions, but it has informed our sales gaps, demand planning, and sales reporting."
“We’re beyond impressed with the results and the TrewUp Teams’ commitment to creating value and usage for us. We heartily recommend TrewUp to any CPG brand looking to increase efficiency and focus on growth.”
“We can confidently say that TrewUp is a game changer. It’s been a seamless integration with tremendous impact.”
I would highly recommend any startup company coming to TrewUp. You've been great. I'm always willing to help because the platform has made such a difference for our business.
"It really just simplifies everything for me in a one-stop shop."
“The hours we’ve reclaimed since implementing TrewUp are invaluable. What used to be a time-consuming, manual hunt for discrepancies is now swift and seamless. This software hasn’t just saved us time; it’s transformed the way we manage our finances.”
“The platform empowers us to swiftly identify invalid deductions, and the collaborative features have revolutionized our team’s communication. We can challenge and rectify discrepancies with such ease; it’s truly a game-changer for our operations.”
"This software hasn't just saved us time; it's transformed the way we manage our finances."
“TrewUp allowed us to optimize our trade spend and sell more product at higher margins! The insights and efficiencies we gained have been invaluable to our sales strategy.”
“With TrewUp, we immediately identified $60,000 in incorrect brand name deductions. This tool has been instrumental in ensuring our financial accuracy and instilling confidence in our revenue management.”
"This tool not only helps with getting money back from deductions, but it has informed our sales gaps, demand planning, and sales reporting."
“We’re beyond impressed with the results and the TrewUp Teams’ commitment to creating value and usage for us. We heartily recommend TrewUp to any CPG brand looking to increase efficiency and focus on growth.”
“We can confidently say that TrewUp is a game changer. It’s been a seamless integration with tremendous impact.”
I would highly recommend any startup company coming to TrewUp. You've been great. I'm always willing to help because the platform has made such a difference for our business.
"It really just simplifies everything for me in a one-stop shop."
“The hours we’ve reclaimed since implementing TrewUp are invaluable. What used to be a time-consuming, manual hunt for discrepancies is now swift and seamless. This software hasn’t just saved us time; it’s transformed the way we manage our finances.”
“The platform empowers us to swiftly identify invalid deductions, and the collaborative features have revolutionized our team’s communication. We can challenge and rectify discrepancies with such ease; it’s truly a game-changer for our operations.”
"This software hasn't just saved us time; it's transformed the way we manage our finances."
“TrewUp allowed us to optimize our trade spend and sell more product at higher margins! The insights and efficiencies we gained have been invaluable to our sales strategy.”
“With TrewUp, we immediately identified $60,000 in incorrect brand name deductions. This tool has been instrumental in ensuring our financial accuracy and instilling confidence in our revenue management.”
"This tool not only helps with getting money back from deductions, but it has informed our sales gaps, demand planning, and sales reporting."
“We’re beyond impressed with the results and the TrewUp Teams’ commitment to creating value and usage for us. We heartily recommend TrewUp to any CPG brand looking to increase efficiency and focus on growth.”
“We can confidently say that TrewUp is a game changer. It’s been a seamless integration with tremendous impact.”