
You already know the ROI formula for trade promotions. The problem is your denominator. When realized trade costs arrive late, are split across portals and PDFs, and are inconsistent, teams don’t trust the number.
This guide will help you build weekly ROI from post-invoice actuals. You’ll learn how to:
- Attribute deductions and billbacks by retailer, SKU, and promotion.
- Track recoveries as they resolve.
- Get finance and sales teams on the same realized spend.
And you’ll do it all before month-end.
Main Takeaways
- Trade spend return on investment requires realized costs as the denominator, not planned accruals.
- Categorize deductions by type, retailer, and promotion for accurate cost attribution.
- Weekly processing keeps ROI current and prevents month-end reconciliation surprises.
- Baseline estimation methods vary by use case. Choose based on seasonality and distribution changes.
- Successful dispute recoveries reduce realized costs and improve ROI.
ROI vs. Trade Rate: Two Numbers You Need and Why They Get Confused
.webp)
Promotion ROI measures incremental gross profit from a promotion. It requires knowing your baseline, margin, and cost attribution. It’s calculated as:
(Promo Profit - Realized Trade Cost) ÷ Promo Cost x 100
Realized trade cost is the sum of post-invoice charges, claims, and fees. These costs reduce net revenue for a promotion, and include:
- Deductions
- Billbacks
- Scan allowances
- Fees
- True-ups
You can measure ROI at three levels, depending on the decision you need to make:
- Event ROI measures one promotion at one retailer. Use this for promo depth and timing decisions.
- Customer/retailer ROI rolls up all events with one retailer. Use this for annual planning and negotiation.
- Program ROI rolls up spend across retailers by promo type or budget line. Use this for portfolio allocation.
The trade rate is realized trade spend as a percentage of sales, by customer, period, and product line. It measures the efficiency of your spending on promotions. It typically represents 15%–20% of revenue, and is calculated as:
(Total Trade Spend ÷ Gross Revenue) x 100
Most lean teams can get a credible trade rate faster than true event-level ROI. This is because baseline and incrementality are messy without solid retail data.
How to Calculate Incremental Profit Without a Data Science Team
.webp)
Calculating incremental profit requires knowing your baseline volume. You can estimate this using three practical methods.
Baseline Estimation Methods and Best Use Case
Once you have baseline volume, use the following calculation to determine incremental gross profit:
Promo Period Gross Profit - (Baseline Volume x Average Unit Margin)
Baseline Distorters That Inflate Apparent Lift
Several factors can distort your baseline and inflate apparent lift:
- Out-of-stocks during baseline weeks can lower your baseline.
- Forward-buy and pantry-loading can shift volume into the promo window.
- Distribution gains during the promo can look like lift, but may not be promotion-driven.
The Visibility You Need for Realized Trade Cost
.webp)
A lack of visibility into various cost types across sources is the primary reason teams can’t calculate ROI. Without the following metrics, you can’t calculate realized trade cost, and therefore promotion ROI.
Realized Trade Cost Metrics You Need
You need one classification system for every source, so you can attribute costs to the right retailer, SKU, and promotion.
Deduction management software supports this by extracting and categorizing deductions by type, reason, and retailer. It gives you clear visibility into each metric you need to determine realized trade cost.
5-Step Workflow for Weekly, Close-Ready Trade Spend ROI
.webp)
CPG marketing budgets dropped to 6.7% of revenue in 2024, the lowest in five years, per Gartner. Leadership expects trade spend decisions backed by defensible ROI.
Here’s a weekly workflow to get you from post-invoice actuals to ROI-ready reporting in a reliable, repeatable way.
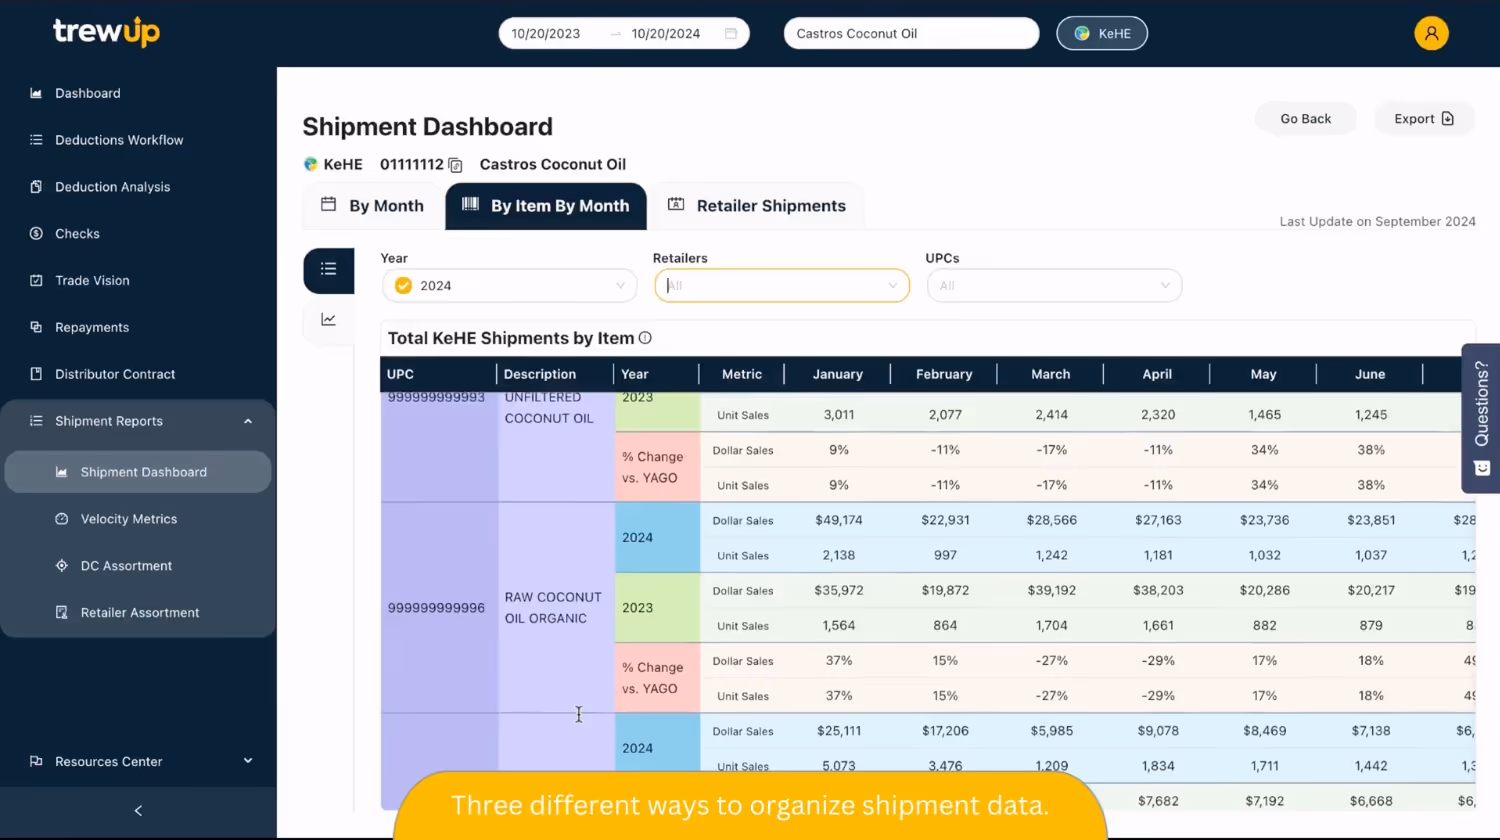
1. Ingest Deductions and Claims from Every Portal and PDF
Gather deduction files from all distributor and retailer portals, like UNFI, KeHE, and Walmart Retail Link. Include PDF claims, emailed billbacks, and EDI remittance details.
Consolidate everything into one repository so nothing sits in a portal or inbox.
2. Categorize by Cost Type, Reason Code, and Retailer
Apply the above taxonomy to every line. Tag each deduction with a retailer and reason code. Tag the promotion or item when you can.
Consistent tagging makes later attribution possible.
3. Match Claims to Accruals and Your Promo Calendar
Compare incoming claims to your accrual schedule and promo calendar. Flag variances early. Look for:
- Claims higher than accrued
- Claims for promos you didn’t run
- Missing claims for completed events
This finds disputes early, rightens reconciliation, and uncovers root causes.
Running a lean team or dealing with a backlog? Use trade promotion management tools that link deductions to planned promotions for faster matching.
4. Attribute Resolved Costs to Retailer, SKU, and Promotion
Assign each resolved deduction to a promotion event, retailer, and funded SKU.
Attribution turns raw deductions into an ROI denominator, making event-level ROI possible. Without it, you only get total trade spend and won’t know which promos paid off.
5. Track Status and Report Weekly
Track the status of each deduction: open, resolved, disputed, or written off. Run a weekly review and update ROI. Include newly resolved items in the update and flag aging disputes. This helps you avoid month-end surprises.
If your technology stack doesn’t automatically track source data and update analytics dashboards, it may be time to invest in trade spend analytics software.
Decision Rules That Turn ROI Output into Action
.webp)
ROI output drives action. For example, if ROI is positive and disputes are low, the event worked. If ROI is positive but dispute rate is high, fix your claims and compliance process before adjusting promo depth—you may be leaving recoveries on the table.
Below are patterns to watch for, what’s driving them, and what actions to take when they happen.
Metrics To Watch and Actions to Correct the Issue
If one retailer consistently underperforms, use the data to renegotiate terms, tighten promo types, or reallocate spend to higher-ROI partners.
Trade spend optimization tools streamline this process, showing you which investments drive results, which erode margins, and where to reallocate.
Why Recoveries Change Your Final ROI Number
Recovery rate is an important KPI to track. Successful disputes reduce realized trade cost, improving ROI. However, backlog kills recovery windows and locks in lower ROI.
Model ROI before and after recoveries to see the margin impact of faster dispute resolution.
Build Weekly ROI Reporting from Actuals with TrewUp
Trade spend ROI is trustworthy only when costs arrive fast and tie back to the promotions that drove them.
TrewUp automates the entire workflow, so you get weekly, close-ready trade spend ROI metrics. Reduce manual work and align finance and sales teams with real-time trade spend performance by retailer, promo, and UPC/SKU.
See how CPG brands turn fragmented deductions into weekly ROI reporting that protects margins—book a demo.