

Main Takeaways
- Trade promotion effectiveness is whether a promotion generated incremental volume that justified its actual cost.
- Most ROI calculations fail because deductions arrive weeks late with no automatic link back to the originating promotion.
- True promotion cost requires matching every chargeback, billback, and scan deduction to the event that triggered it.
- Incremental lift, forward buying, and cannibalization each require different follow-up actions when planning the next event.
- When you reconcile actuals, classify outcomes, and reallocate dollars based on event-level ROI, post-promotion analysis becomes trade spend optimization.
What Is Trade Promotion Effectiveness?

Trade promotion effectiveness answers one question: Did a promotion generate incremental volume, revenue, or profit that justified its actual cost?
Trade promotion management handles the upstream work. Trade promotion effectiveness sits on the measurement side of trade spend. It tells you whether the promotion produced results above your baseline.
A trade promotion can take many forms:
- Temporary price reductions
- Display allowances
- Feature fees
- Scan deals
- Manufacturer chargebacks (MCBs)
- Off-invoice discounts
- Demos
Why Trade Spend Effectiveness Matters
For most CPG brands, trade spend reaches as high as 25% of gross sales—one of the largest P&L line items.
Between 2022 and 2023, CPG unit volumes declined 4%, according to McKinsey. When baseline demand is shrinking, every promo dollar has to earn its place.
If your team can't connect planned terms to the deduction actuals that arrive weeks later, there’s no way to separate real lift from subsidized baseline.
Why Trade Promotion Effectiveness Is Cross-Functional
Trade promotion effectiveness isn’t just a sales metric.
- Consumers respond to perceived value, not internal ROI models.
- Sales tracks planned spend and expected volume.
- Finance sees deductions, accruals, and net sales.
- Retailers care about category growth and traffic.
Without a shared event-level record—same promotion, same actual cost, same outcome classification—teams debate spreadsheets instead of investment decisions.
What Actually Drives Trade Promotion Effectiveness

Measurement tells you what happened. Drivers explain why. Key levers that influence promotion performance are:
- Competitive activity: Competitor promos alter baseline demand.
- Deal depth: Deeper discounts increase volume but often inflate non-incremental sales and cost.
- Duration: Longer windows increase forward buying risk and post-promo dips.
- Merchandising support: Display and feature change conversion, but increase fees.
- Timing and seasonality: Baseline variability can distort perceived lift.
- Retailer execution: Shelf compliance determines real impact.
You can’t optimize these levers reliably until you can measure event-level ROI using actual promotion cost. And that requires deduction matching.
How to Measure Trade Promotion Effectiveness: Metrics and Formulas

Five inputs drive event-level measurement:
- A clear objective
- A baseline
- Sell-in and sell-through signals
- True cost from deduction actuals
- A formula that ties them all together
Here is the event-level workflow:
- Set the promotion objective and success criteria—volume target, revenue goal, or margin threshold.
- Establish a baseline for the promoted SKU-retailer combo during a comparable non-promoted period.
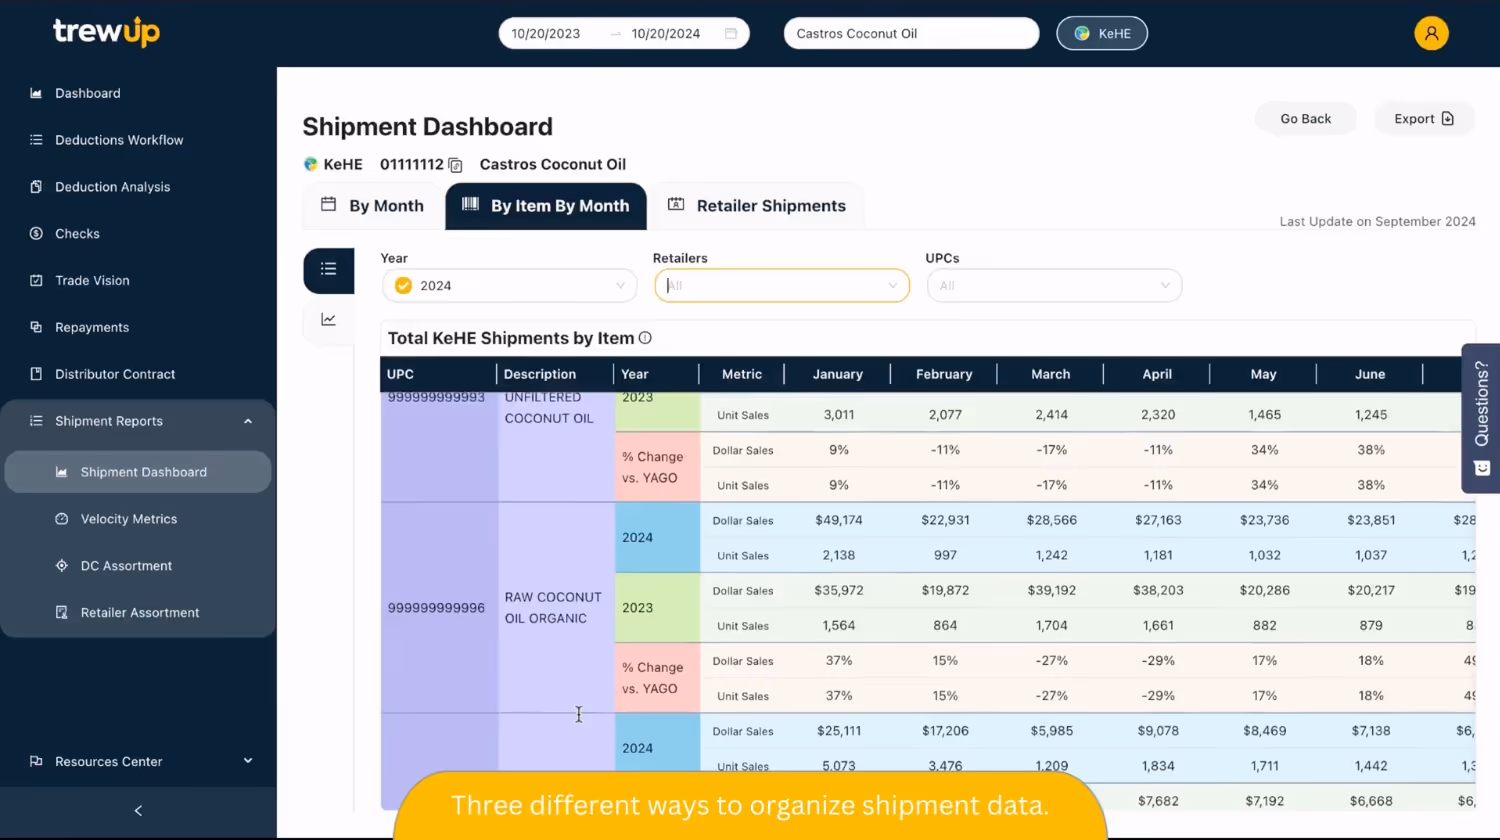
- Collect sell-in and sell-through signals (shipment and order data on the sell-in side, POS or depletion reports on the sell-through side) during and after the event window.
- Capture true promotion cost by pulling every related deduction—chargebacks, billbacks, scan and MCB deductions—and matching them to the original event.
- Calculate incremental lift and ROI using actual spend, not the planned budget line.
A 2024 POI survey found that 88% of CPG companies struggle to manage enterprise trade spend. Of those, 44% point to data cleansing and harmonizing as a direct barrier. The bottleneck is operational, not analytical.
Automating deduction retrieval and categorization can redirect effort toward matching and analysis. For teams building this capability, trade promotion management software closes the gap between planned events and post-invoice actuals.
Trade Promotion Metrics and Formulas
None of these formulas is complicated. The hard part is feeding them with real cost data—and that's a deduction-matching issue.
Classifying Trade Promotion Results

Trade promotion analysis classifies event volume into three outcome types:
- True incremental lift
- Forward buying
- Cannibalization
Each one carries a different implication for whether you should run the event again.
True Incremental Lift
This new consumption wouldn't have occurred without the promotion. You can spot it when POS rises during the event window, and the post-promo baseline holds steady within 2–4 weeks. Sister-SKU sales should show no corresponding dip.
Forward Buying
This happens when retailers or consumers stock up during the deal. They pull future demand into the promo window instead of creating new demand. It’s indicated when sell-in spikes during the promotion, but sell-through stays flat or barely moves. Post-promo orders then drop sharply below baseline for 4–8 weeks.
Cannibalization
This occurs when the promoted SKU gains volume at the expense of your own adjacent items. The promoted SKU lifts, but total brand volume stays flat or declines. Sister SKUs show a measurable dip during the same window.
Use the table below to map what you see in the data to what you should do next.
Trade Promotion Analysis Outcome Types
How to Move from Measurement to Optimization
Classifying a single event is useful. Doing it consistently across every promotion and feeding those results back into planning is what actually improves trade spend over time.
Post-promotion analysis is the process of reconciling planned terms against deduction actuals, classifying outcomes, and documenting what you learned. It's the only reliable input for trade spend optimization. Here’s how to do it:
1. Build The Foundation
Before you can trust ROI, you need clean event-level actuals.
- Define each promotion clearly (retailer, SKU, mechanic, dates, planned terms).
- Retrieve and categorize every related deduction—chargebacks, billbacks, scan claims, fees.
- Match each deduction back to the promotion that triggered it.
If deduction actuals aren’t tied to events, every downstream metric is distorted.
2. Measure Performance
Once the actual cost is reliable, you can measure performance accurately.
- Establish a baseline and calculate incremental lift.
- Compute ROI using actual promotion cost, not planned budget.
- Track planned vs. actual variance by retailer and promo type.
3. Optimize
Optimization begins when measurement becomes repeatable.
- Reallocate dollars away from bottom-quartile events.
- Standardize decision rules (when to rerun, resize, dispute, or stop).
- Feed outcome classifications back into the next planning cycle.
Advanced analytics cannot compensate for a broken foundation. Clean, matched actuals come first.
Reconciling across multiple distributors and retailers at the same time slows the process. Vigo/Alessi reduced that effort from weeks to days. How? They used deduction visibility dashboards that link actuals to promotions.
Measure Trade Promotion ROI with Confidence Using TrewUp
Start by reconciling planned terms against deduction actuals. Classify whether volume was truly incremental. Then feed those results into the next planning cycle so each round of spend gets sharper.
TrewUp automates the connection between post-invoice deduction actuals and the promotions that triggered them. Your team can calculate true ROI with clean, matched actuals—without chasing PDFs across distributor portals. Margin erosion becomes visible earlier, so you can redirect spend toward events that create real demand.
Book a demo to see how TrewUp turns fragmented deduction data into event-level ROI you can act on.