

You planned a temporary price reduction with UNFI three months ago. The promotion ran. Now a deduction document shows up in the portal weeks late. It's labeled "miscellaneous," with no stock keeping unit (SKU) detail. The dollar amount doesn't match your accrual. Your finance team is reconciling trade spend across UNFI, KeHE, and Kroger. But deductions hit Accounts Receivable (AR) in different formats, on different timelines, through different portals.
Trade spend becomes a margin problem when planned promotions can't be matched to actual deductions. This article gives you the formula to calculate your trade rate and the profit and loss statement (P&L) framework to record it correctly. You'll also get the distributor deduction tracking workflow you need to close the gap before recovery windows expire.
Main Takeaways
- Trade spend is recorded as a reduction to gross sales, not as a marketing expense below the line.
- Mid-market Consumer Packaged Goods (CPG) brands typically spend 15-25% of gross sales on trade, with rates above 25% signaling potential margin leakage.
- Deductions arrive weeks or months after promotions run, creating timing gaps that distort accruals and compress month-end close windows.
- Every distributor uses different portals and posting schedules, making it difficult to reconcile planned spend against actual deductions.
- Without connecting deduction actuals back to specific promotions and SKUs, you cannot measure trade promotion ROI accurately.
Types of Trade Spend and How It Differs From Marketing Spend

Trade spend in CPG covers every dollar a manufacturer pays to retailers and distributors. These payments earn shelf placement, fund promotions, and move volume. For most brands, it's the second-largest P&L line item after cost of goods sold.
That scale is why Revenue Growth Management (RGM) treats trade spend as the single highest-impact lever on the P&L. But a lever only works if you can trust the numbers under it. Trade spend moves margin in either direction, and which way it moves depends on whether you can connect what you planned to what actually posted.
The four primary types of trade spend break down as follows:
- Temporary price reductions (TPRs): A discounted shelf price for a set window. For example, a $1-off scan at Kroger on a top-selling SKU during a seasonal push.
- Slotting fees: One-time or recurring payments to secure shelf space. One example is a new-item fee paid to UNFI for regional warehouse access.
- In-store displays and merchandising: Funding for endcaps, shippers, or secondary placements. Think of a floor display at a regional grocery chain during a holiday promotion.
- Joint marketing and co-op advertising: Shared-cost programs where the brand funds retailer-run ads or circular features. For instance, co-funding a digital circular spot with a natural channel retailer.
These types split into two groups. Working spend (TPRs, displays, demos) directly shapes a shopper's purchase decision at the point of sale. Non-working spend (slotting fees, listing fees, fixed placement charges) buys access to the shelf but doesn't generate volume on its own. Revenue growth models rely on this difference to gauge whether your trade dollars are driving returns or just paying for entry.
Trade Spend vs. Marketing Spend
Both trade spend and marketing spend show up on the P&L. But they flow to different recipients, sit in different budget groups, and land on different line items. The line between them is getting harder to draw. Retail media is growing roughly 25% per year and is approaching $100 billion in the US, according to Boston Consulting Group. That growth pulls dollars once housed in one bucket into a gray zone between trade and brand spending.
How Trade Spend and Marketing Spend Differ on the P&L
How to Calculate and Benchmark Your Trade Rate
To calculate your trade spend rate, divide total trade spend by gross sales and multiply by 100. Some sources use net sales as the bottom number. But gross sales keeps the math consistent with how trade dollars sit on the P&L, as a reduction from the top line, not an expense below it. According to 2025 data from the Promotion Optimization Institute (POI), CPG companies spend between 11% and 27%+ of revenues on trade promotions.
For mid-market CPG brands, trade spend as a percent of sales typically lands in the 15-25% range. If your rate pushes above 25%, examine your promotion mix and the share of non-working spend. A climbing rate without matching volume lift usually points to a problem later in the process. That problem is how deductions are tracked and reconciled, not a flaw in the spend agreement itself.
Your trade rate and spend mix give you a starting point. But the number only reflects what you committed, not what you recovered or what actually posted as a deduction.
Trade Spend Accounting: P&L Treatment, Accruals, and Timing

Most trade spend hits your P&L as a reduction of revenue, not as a marketing or SG&A expense. Your gross-to-net waterfall is where these dollars live. Getting the category right matters for every metric built from it.
ASC 606 sets the rule: payments to a customer (discounts, rebates, slotting fees, promotional allowances) reduce the transaction price. The exception is when the payment buys a distinct good or service, as outlined in Deloitte's ASC 606 guidance. In practice, most trade spend nets against gross revenue rather than showing below the line. When this category is wrong, gross margin, net revenue, and every key performance indicator (KPI) that depends on them are skewed.
The timing question is just as important. You accrue trade spend when the promotional obligation occurs, not when the deduction document lands in your portal. But deductions from distributors and retailers routinely arrive weeks or months later. That means your accruals are estimates until actuals confirm them. The gap between what you accrued and what actually posted is where P&L swings come from.
When deductions show up after the period closes, you're adjusting prior-period accruals under time pressure. This shortens close timelines and chips away at confidence in reported numbers. Standards in this area keep evolving. In May 2025, the Financial Accounting Standards Board (FASB) issued an Accounting Standards Update (ASU) clarifying how to treat share-based payments to customers. That rule takes effect for fiscal years starting after December 15, 2026, as summarized by EY AccountingLink.
Until deduction actuals confirm your accruals, every trade spend figure on your P&L is an estimate. The longer that takes, the less confidence you carry into close.
How Trade Spend Becomes a Deduction: Where Trade Spend Management Breaks Down

A promotion doesn't end when it runs. It becomes a deduction workflow. Most brands aren't equipped to reconcile what they planned to spend against what actually showed up in AR.
The sequence starts when your team signs a promotional agreement with a retailer or distributor. The promotion runs in-store. Then, weeks or months later, the retailer nets the promotional cost against your invoice. A deduction document posts to their portal. UNFI pays invoices "net of any deductions, chargebacks and fees," per its supplier terms. Kroger's promo-deduction data may take a week to load after payment. Disputes must be filed within 180 days according to Kroger's supplier documentation. KeHE pushes Manufacturer Chargebacks (MCBs) and placement charges through CONNECT on its own schedule.
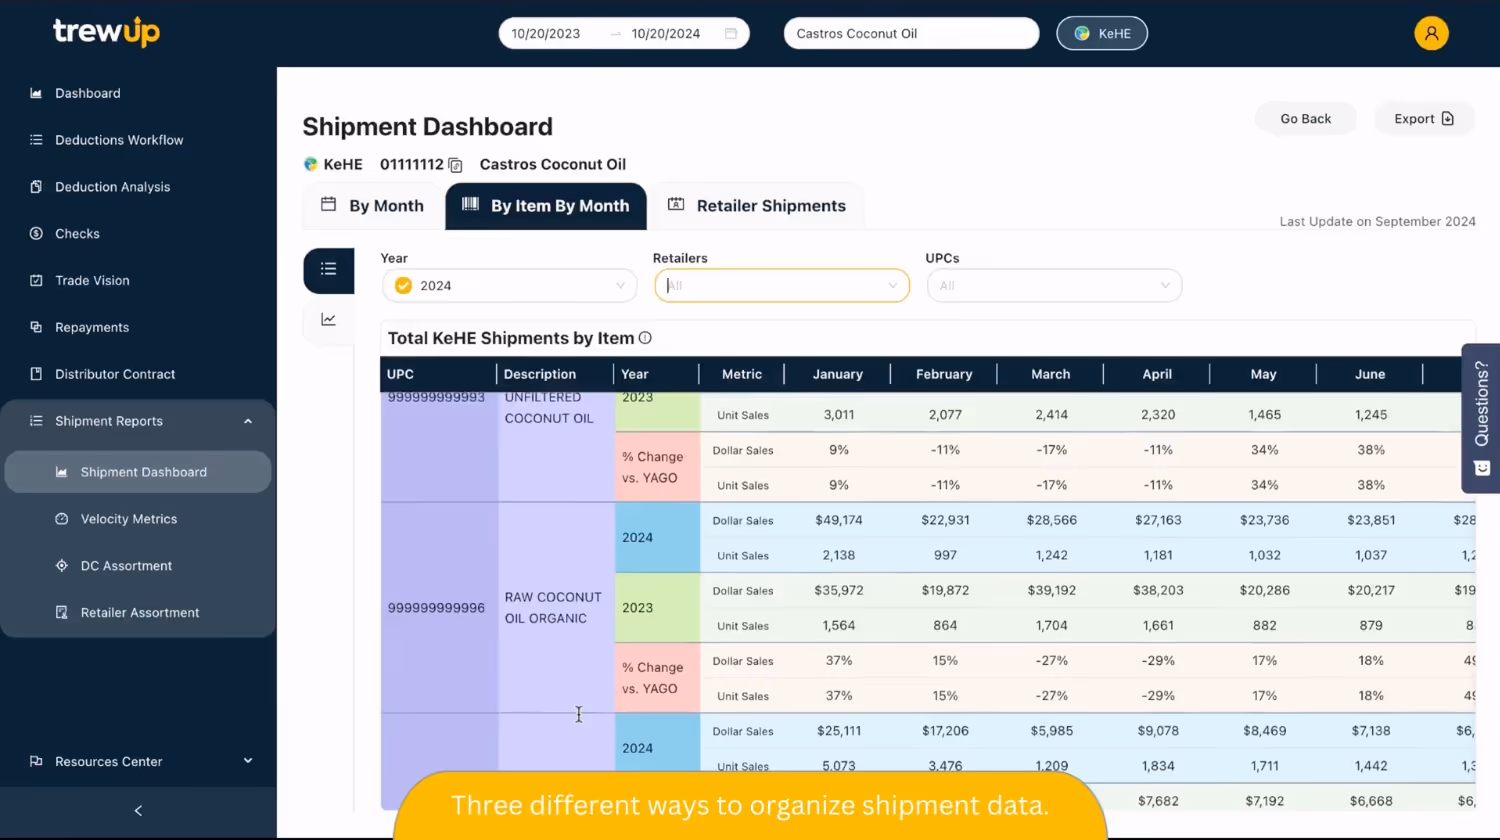
This is where deductions management breaks down. Every distributor runs a different portal with different document formats and different posting timelines. Your finance team is reconciling deductions from three or more sources. Those deductions must match promotional agreements that may live in a spreadsheet or a Trade Promotion Management (TPM) system that doesn't talk to any of them.
The result: backlogs pile up, and dispute windows close before anyone reviews the line items. Conservative write-offs become the default at month-end because the team lacks time or confidence to validate every deduction. Platforms like TrewUp connect promotional agreements to deduction actuals across UNFI, KeHE, and Kroger in a single dashboard. That closes the gap between what was planned and what actually posted.
Why Trade Promotions Fail
Salesforce reports that fewer than half of trade promotions deliver a positive return. At the same time, 61% of CPG manufacturers say they struggle to execute promotions as planned, per the Promotion Optimization Institute's 2025 State of the Industry report. The gap between promotional intent and in-store reality is wide, and it has structural causes.
- Forward buying: Retailers load up on inventory during the deal window and cut orders afterward. This shifts volume in time without creating new demand.
- Cannibalization: The promoted SKU pulls sales from your other items instead of growing the category. Total brand revenue stays flat while margin drops.
- Shallow TPRs: A discount too small to change shopper behavior generates cost without producing incremental lift.
- Non-incremental volume: The units would have sold at full price regardless. The promotion simply subsidized demand that already existed.
Diagnosing which failure mode is eroding your margin requires matching deduction actuals back to the specific promotion and SKU. Without that link, trade promotion ROI is a guess. You can't fix what you can't measure. Once you can measure it, the fix is direct: keep the promotions that produce real lift, and stop funding the ones that don't.
The gap between planned trade spend and actual deductions isn't just an accounting hassle. It's the reason most brands can't tell whether their promotions are working until the window to adjust has already closed.