.webp)

You don’t need a strategy deck that stops at trade spend as a lever. You need a cost takeout approach with auditable savings that includes what actually hit the GL: trade spend and deductions.
This guide adds operating detail to standard cost takeout work. In it, you’ll learn how to:
- Build a value tree by Profit and Loss (P&L) bucket.
- Set a proof standard for real savings.
- Build a trade plan with a weekly cadence.
- Set an operating model that keeps trade spend controlled, turning it into measurable margin gains.
Main Takeaways
- Cost takeout needs process changes that stop repeat costs. It’s not a short-term expense cut.
- Building a value tree by P&L category helps prioritize, measure, and prove savings.
- Trade spend savings are real only when you match plans to post-invoice actuals.
- Triage a deduction backlog by amount, age, and dispute window to raise recovery impact.
- Use metrics like accrual variance and cycle time to prove trade spend savings.
What CPG Cost Takeout Actually Means
.webp)
CPG cost takeout lowers operating costs through durable, measurable margin gains—not temporary cuts. It removes costs from the operating model, so they don’t return in later periods. This creates a leaner, more profitable org.
One-time cuts (like hiring freezes and spending pauses) only lower costs temporarily. Durable cost takeout requires changes to processes, contracts, or workflows.
The CPG Cost Takeout Value Tree: Savings by P&L Bucket
.webp)
Your value tree must separate cost takeout levers by P&L category. That enables you to focus on what's controllable and provable.
First, pick the lever with the biggest controllable gap between planned and actual spend. You should be able to prove savings in 90 days. Trade spend can move faster with strong deduction work and actuals reconciliation.
Overview of Cost Takeout Levers by P&L Category
COGS and Manufacturing Levers
COGS levers represent the direct cost to produce finished goods and are driven by material input costs, plant efficiency, and production scale. Typical levers include:
- Formulation and BOM optimization
- Yield and scrap reduction
- Footprint or capacity rationalization
Logistics swings add noise to COGS, affecting accruals and margin predictability. For example, truck spot rates have risen about 9% year over year, as reported in DAT Freight & Analytics. This volatility shows why weekly variance review matters.
Logistics and Freight Levers
Logistics and freight are a major cost takeout lever in CPG because transportation, warehousing, and handling directly scale with volume and network design. This makes them highly sensitive to optimization and sourcing decisions.
This bucket includes:
- Inbound and outbound freight
- Intercompany transfers
- Third-party logistics (3PL) fees
- Warehousing and distribution center labor and occupancy
SG&A and Indirect Spend Levers
SG&A and indirect spend are a structurally embedded cost base, tied to organizational design levers. Those can include:
- Organizational delayering and span-of-control optimization
- Zero-based budgeting
- Vendor consolidation and renegotiation
- Automation of back-office and commercial support processes
Private label sales have grown 4.2% year over year, with national brands growing 1.1%, per the NIQ. This reduces pricing power and raises pressure on cost controls, not price hikes.
Trade Spend Levers
Trade spend is often one of the largest and least transparent commercial cost pools.
It includes promotional allowances, deductions, and retailer fees, so it’s a top-3 expense line, but often under-controlled. For example, Monster Beverage reported promotional allowances at 14.7% of their 2024 gross billings, or $1.28B.
Typical trade spend levers include:
- Promotion and event optimization
- Price-pack architecture and discount depth rationalization
- Improved trade ROI analytics
- Tighter governance over customer funding and off-invoice programs
Manage Trade Spend With Post-Invoice Controls
.webp)
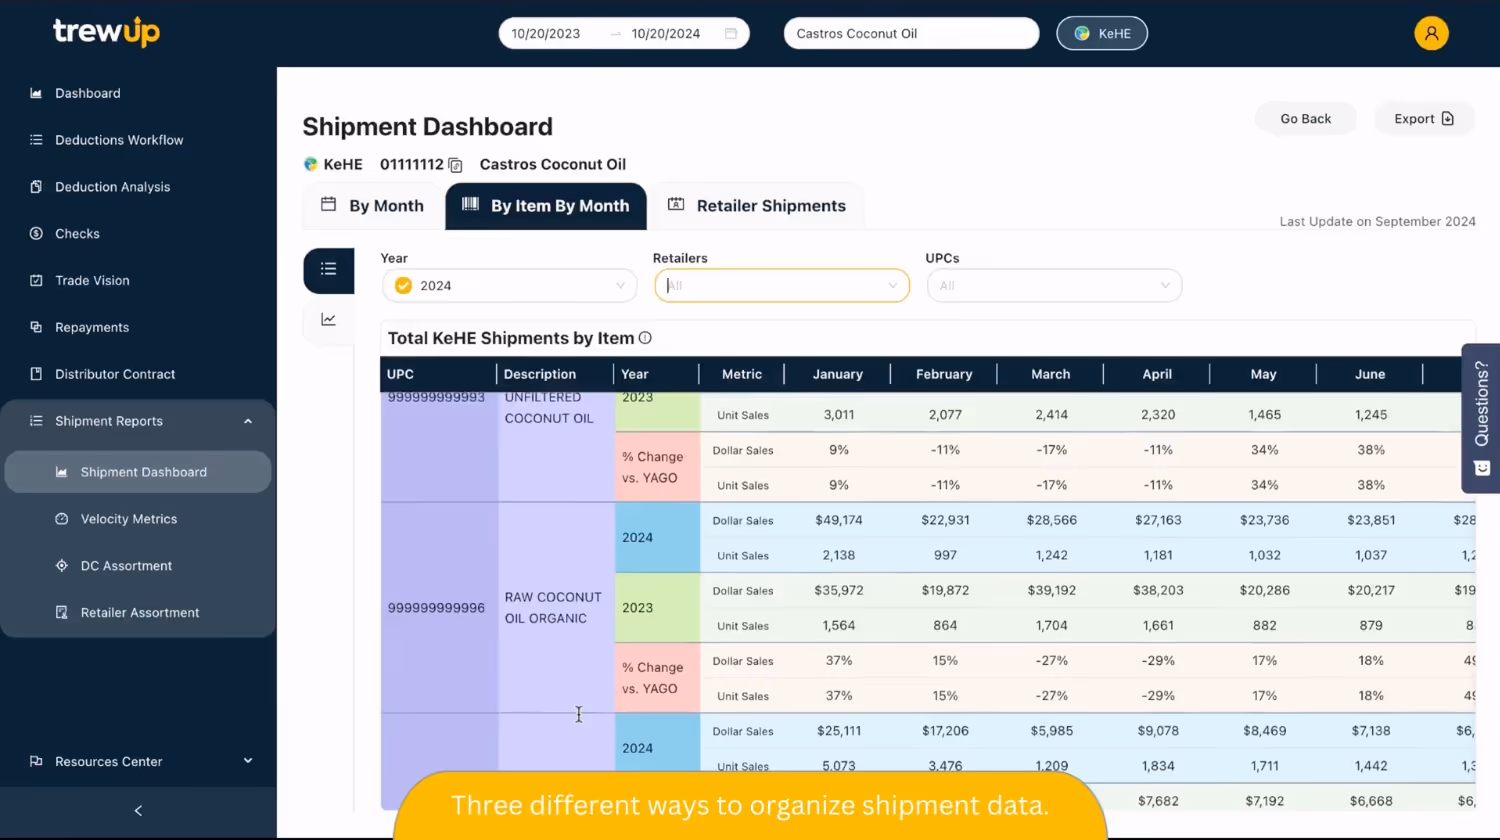
Trade spend savings are real only when you match plans to post-invoice actuals. Trade promotion management systems can help.
High promotion levels raise post-invoice volume, and deductions often arrive weeks after a promotion ends. Without a reliable system, you can’t match deductions to promotion or confirm planned spend to actual spend.
Also, unsettled trade promotion balances can be large at close. For example, Hershey had $221.3M of unsettled trade promotion obligations as of December 31, 2024.
Improve Deduction Workflows
.webp)
Backlogs, delayed categorization, missed recovery windows, and rushed month-end closes cause avoidable margin loss.
Triage and Clear Backlogs
Deduction backlogs drain team time and reduce trust in close results. When you’re behind, triage by dollar value first. Focus on deductions above a specified threshold. This raises recovery impact.
Next, prioritize by age and dispute window. Items near dispute deadlines need action before they become unrecoverable. Then sort by dispute odds. Clear compliance fees are easier to check. Unclear claims may need root-cause work first.
Assign clear owners for each stage. For example, an AR analyst can own Intake and Categorization. The Controller can own Dispute and Close.
Running a lean team? Workflow automation atop existing systems saves time, freeing you up to focus on more productive efforts. In fact, automated retrieval saved Run-a-Ton 20 hours each week.
Once you’ve got a system set, hold a weekly exception queue review to identify repeat leakage sources. Flag items aging past 30 days, items missing backup, and high-dollar items still awaiting review.
Track Metrics to Clear Bottlenecks
Track KPIs weekly to identify places where your process may be causing slowdowns. Key indicators by stage are:
- Intake: time-to-log
- Extract/Normalize: percentage auto-extracted
- Categorize: percentage routed correctly
- Validate: first-pass yield
- Dispute: acceptance rate
- Resolve/Recover: recovery rate
- Close: close timeliness
The Trade Savings Proof Standard
You’ve reconciled accruals to post-invoice actuals for the prior period. You’ve reported on write-off rate reduction, recovery improvements, and accrual variance. Now you need to present proof to leadership using trusted KPIs.
Measurable proof points include:
- Deduction aging: Percentage of open deductions by age bucket (0–30, 31–60, 61–90, 90+ days)
- Cycle time: Average days from deduction receipt to resolution
- Recovery rate by type: Percentage of disputed deductions recovered, segmented by category (billback, compliance, post-audit)
- Write-off rate and reasons: Percentage of deductions written off, with root-cause tagging (expired window, insufficient backup, valid claim)
- Accrual variance: Difference between accrued trade spend and post-invoice actuals, tracked monthly
Use trade spend analytics software to unify deductions, depletion data, and promotion performance into a single source of truth.
Turn Trade Spend Into Provable, Durable Savings
Cost takeout creates durable savings, but it requires staying current on deductions to get provable trade spend savings.
TrewUp supports measurable margin protection with:
- Real-time data pulled from UNFI, KeHE, and Kroger that clarifies spend.
- Automated root-cause analysis and prioritization to focus teams on high-impact efforts.
- A cloud-based, intuitive interface that doesn’t require IT experts or a lengthy ramp-up period.
Close faster and with better accrual accuracy. Book a demo today.