
Trade spend is one of the largest line items in any CPG company’s P&L—and also one of the most misunderstood. In this guide, we’ll define the key components of trade spend, explain how to categorize and calculate them, and show you how to use this knowledge to drive better financial outcomes for your business.
Whether you're a CPG founder, operator, or financial analyst, understanding how trade spend impacts your gross revenue, profitability, and ROI is essential. Let’s start with the basics.
Laying the Foundation: Revenue in CPG
Before diving into trade spend, it’s important to understand how revenue is defined and categorized in consumer packaged goods. Many brands and retailers refer to financials as being either “above the line” or “below the line,” with “the line” referring to Gross Profit.
Here’s how key CPG financial terms break down:
- Gross Revenue: Total invoiced dollars to customers (retailers, distributors) before any deductions.
- Contra Revenue: Reductions to gross revenue, including discounts, allowances, and returns.
- Net Revenue: What’s left after subtracting contra revenue from gross revenue.
- Cost of Sales: Expenses tied to producing and delivering goods, including manufacturing, warehousing, and shipping.
- Gross Profit: Net Revenue minus Cost of Sales.
When discussing CPG financials, you will often hear talk of income and expense accounts as being either “above the line” or “below the line”. In this case, “the line” is simply the dividing line between items impacting Gross Profit (Revenue, contra-revenue, and cost-of-sales) and items that are considered Selling, general, and administrative (SG&A) expenses. Take Pepsi Co.’s most recent financial filing for 2024:
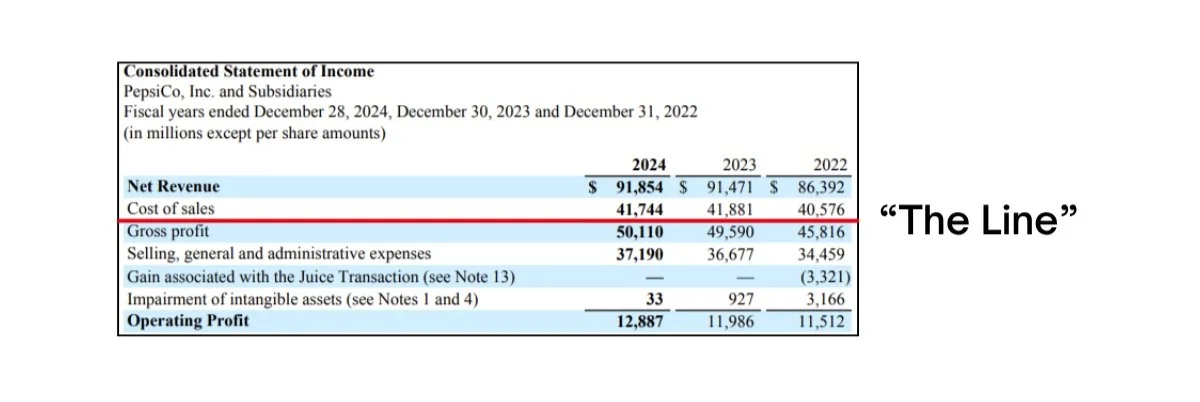
PepsiCo’s financial filings refer to “Net Revenue,” which accounts for deductions like trade promotions and allowances.
What’s Above the Line vs. Below the Line?
Understanding where a cost falls on the income statement helps categorize spend accurately and avoid overstating revenue. Here’s how to think about it:
Above the Line – Contra Revenue
These are not expenses—they're revenue offsets. Getting this categorization right is critical: misclassifying contra revenue can lead to overstated topline and poor financial visibility. These items reduce gross revenue and directly impact net revenue, not operating costs.
- Cash Term Discounts
- Slotting Fees
- Manufacturer Chargebacks (MCBs)
- Off-Invoice Discounts
- EDLPs (Everyday Low Prices)
- Fair Share
- Spoilage Allowances
- Short Shipments
- Returns
Above the Line – Cost of Sales
These are real, recurring expenses required to produce and deliver your product. They fall above the line because they’re essential to getting product on shelf—but they don't increase product value. Tracking them accurately supports margin and supply chain analysis.
- Freight and Delivery Costs
- Damaged Goods
- Shipping Penalties
- Fulfillment Fees
Below the Line – SG&A (Selling, General & Administrative)
These costs support go-to-market execution but aren’t tied to production or fulfillment. They typically fall into sales and marketing spend, and are often evaluated for ROI. Misclassifying them can distort both operating income and trade effectiveness.
- Retailer Ads
- Coupons
- Displays
- Admin Fees
Why This Matters
Accurate categorization isn’t just an accounting exercise—it shapes how you understand profitability, manage trade spend, and prepare for investor or acquirer diligence. When deductions and expenses are lumped together, you lose visibility into what’s driving revenue loss vs. operational cost vs. marketing investment. Clean classification enables clearer financial reporting, sharper performance tracking, and fewer surprises down the road.
What Is Trade Spend in CPG?
Trade spend refers to the funding allocated to promotions and advertising—essentially, dollars spent to drive sales growth and gain competitive advantage at retail. This includes discounts, ad fees, displays, coupons, and other promotional incentives.
But not all trade spend is created equal. Some directly drive purchases. Others are the cost of doing business. That’s why it’s critical to break your spend into working and non-working categories.
Working vs. Non-Working Trade Spend
- Working Trade Spend: These are programs that directly influence a consumer purchase—like scan-based discounts (TPRs), retailer ads, coupons, and display programs. They show up at shelf, impact price perception, and ideally drive volume.
- Non-Working Trade Spend: These are costs that support getting product to shelf, but don’t influence consumer behavior. Examples include spoilage, distributor programs like “fair share,” and administrative fees.
Why does the distinction matter? Because when you lump all trade together, you lose visibility into what’s actually driving lift. On average, we see non-working trade make up ~20% of total trade spend. That means for every $10 million you spend in trade, about $2 million may be going toward programs that don’t convert at shelf.
You probably can’t eliminate non-working trade altogether—but by tracking it, you can minimize waste, renegotiate outdated programs, and reinvest in what works.
Trade vs. Non-Trade Deductions
Here’s another helpful lens: some deductions fall under trade spend (tied to promotions), while others are non-trade (operational or logistical penalties).
Trade Spend (Promotional):
- Promotions
- EDLPs
- Display Fees
- Promotional Admin Fees
- Advertising
- Fair Share
Non-Trade Spend (Operational):
- Logistics Fees
- Spoils
- Shortages
- Fines and Penalties
Slotting Fees are a gray area—technically trade-related, but many brands choose to carve them out into a separate budget. Whether you include them in trade or not depends on your stage, scale, and internal reporting preferences.
How to Calculate Trade Rate and Trade Budget
Trade spend is often one of the biggest lines on your P&L—so it needs structure. That’s where trade rate and trade budget come in.
Trade Rate
Your trade rate is your total trade spend expressed as a percentage of gross revenue:
Formula:
Trade Rate = Trade Spend ÷ Gross Revenue
This is the most common way CPG brands track and benchmark promotional spending—because revenue is rarely static. A percentage-based view allows you to stay grounded, even when topline shifts.
Trade Budget
Your trade budget is the planned trade spend your team aligns on—typically expressed as a % of revenue. Let’s say you set your trade rate target at 15% and project $5,000,000 in revenue for the year. That gives you a trade budget of $750,000.
But what happens when actual revenue varies?
- If you hit $5.5M in revenue and spend $825,000, your trade rate is still 15%—right on plan.
- If revenue dips to $4M and you still spend $825,000, your trade rate jumps to 20%—overspend.
This is why trade rate is so important: it gives you a normalized way to evaluate trade performance, even as sales fluctuate. It helps teams stay accountable to their promotional goals without needing to re-forecast every week.
What Is a Blended Trade Rate?
Not every promotion will hit your target trade rate—and that’s okay. Most CPG brands run different types of events throughout the year, some designed to drive ROI, others to defend shelf space or boost trial. That’s where blended trade rate becomes a useful planning and reporting tool.
Blended trade rate represents your total trade spend as a percentage of revenue over a set period, typically a quarter or fiscal year. It allows you to run higher-spend events—like deep discounts—without blowing your total trade budget, because you balance them out over time.
Why it matters
Let’s say your brand targets a 15% trade rate. You run a January TPR that results in a 28.5% trade rate—a heavy lift. But then you go dark for February and March. At quarter-end, your total trade spend and revenue blend to a more manageable 14.25% trade rate.
Here’s how it plays out:
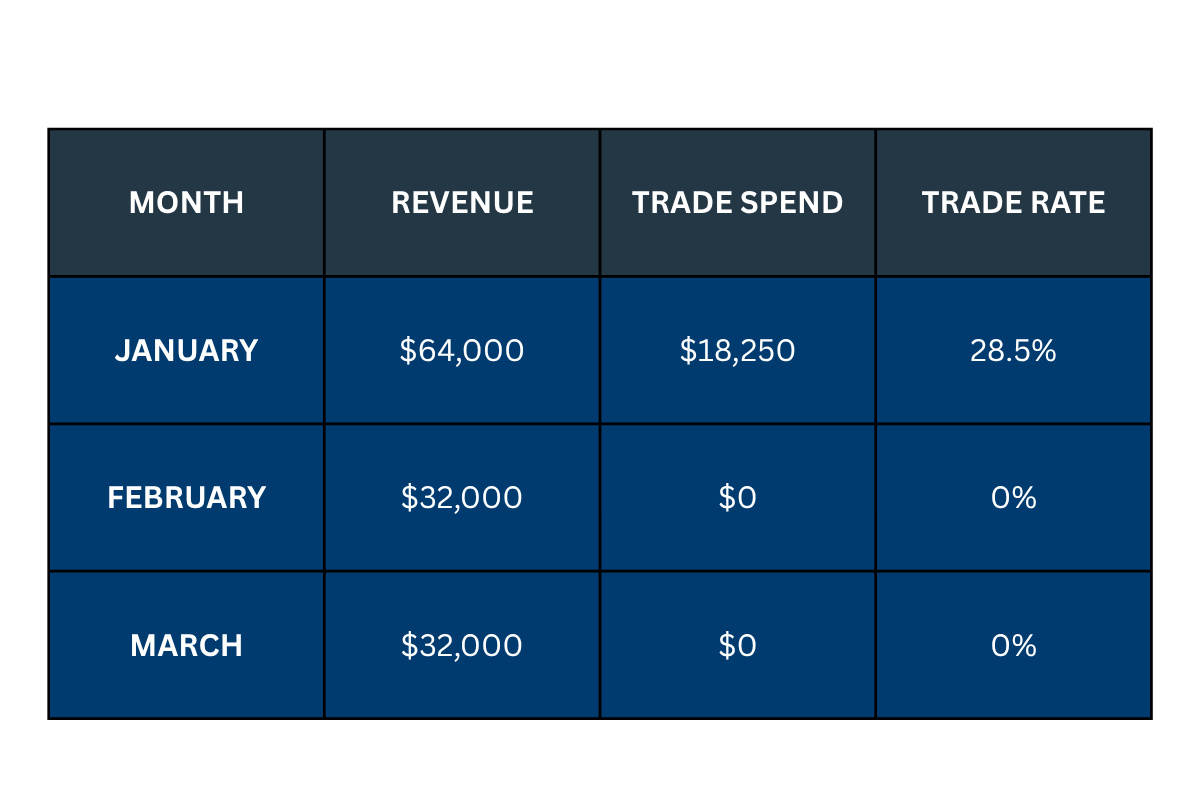
Q1 Total
- Revenue: $128,000
- Trade Spend: $18,250
- Blended Trade Rate: 14.25%
This approach lets experienced CPG operators plan with intent—whether it’s front-loading a launch, pushing trial in a competitive window, or spacing out promotions to protect profitability. Blended rate doesn’t replace ROI analysis, but it helps you track trade spend discipline without micromanaging every event.
Trade Spend ROI: Why It Matters
Not every promotion will be profitable. Some drive trial, some defend shelf space, and others simply miss expectations. That’s why tracking ROI at the event level is essential—not just for reporting, but for making better decisions next time.
Let’s go back to our January TPR example:
- A deep discount + feature ad
- Trade spend rate = 28.5%
- Revenue lift... but not enough to generate profit
- Net result: Negative ROI
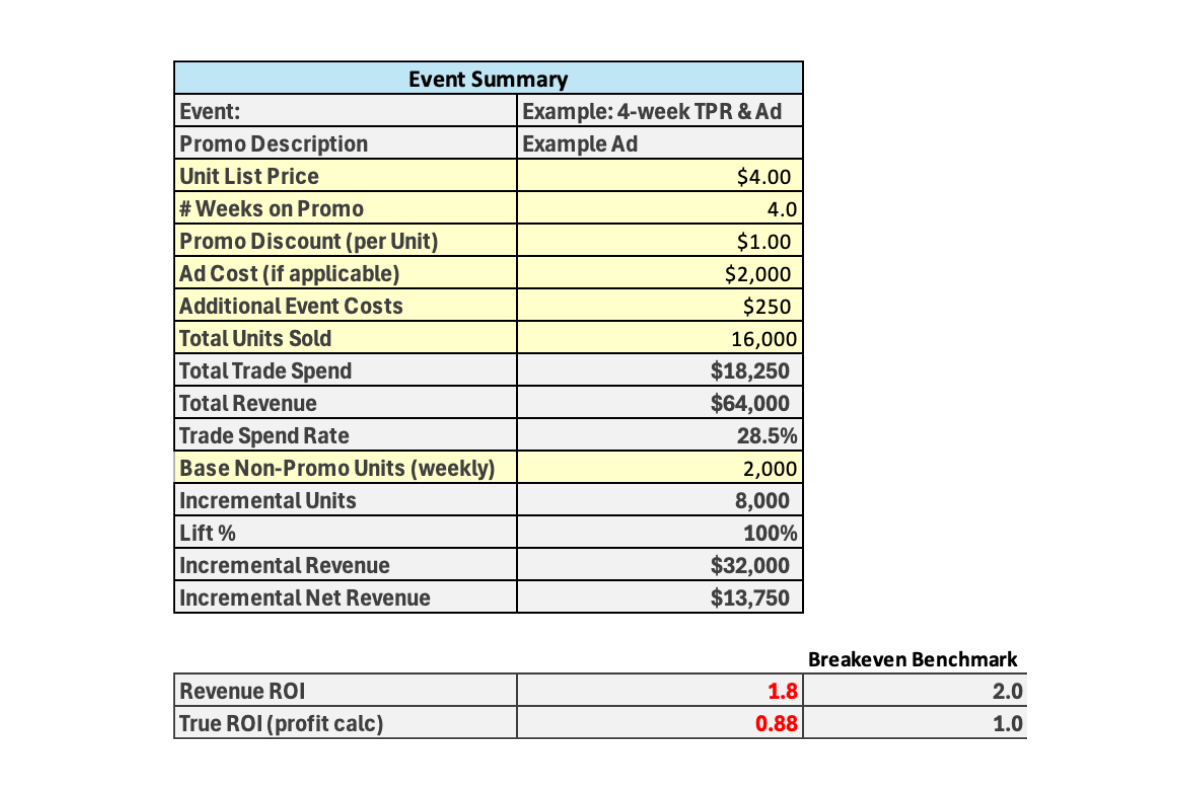
In this example, the brand spent $18,250 to generate $64,000 in revenue—but only $13,750 in incremental net revenue. The result? A True ROI of 0.88, well below the 1.0 breakeven threshold. They sold more units, but actually made less money than before the promo.
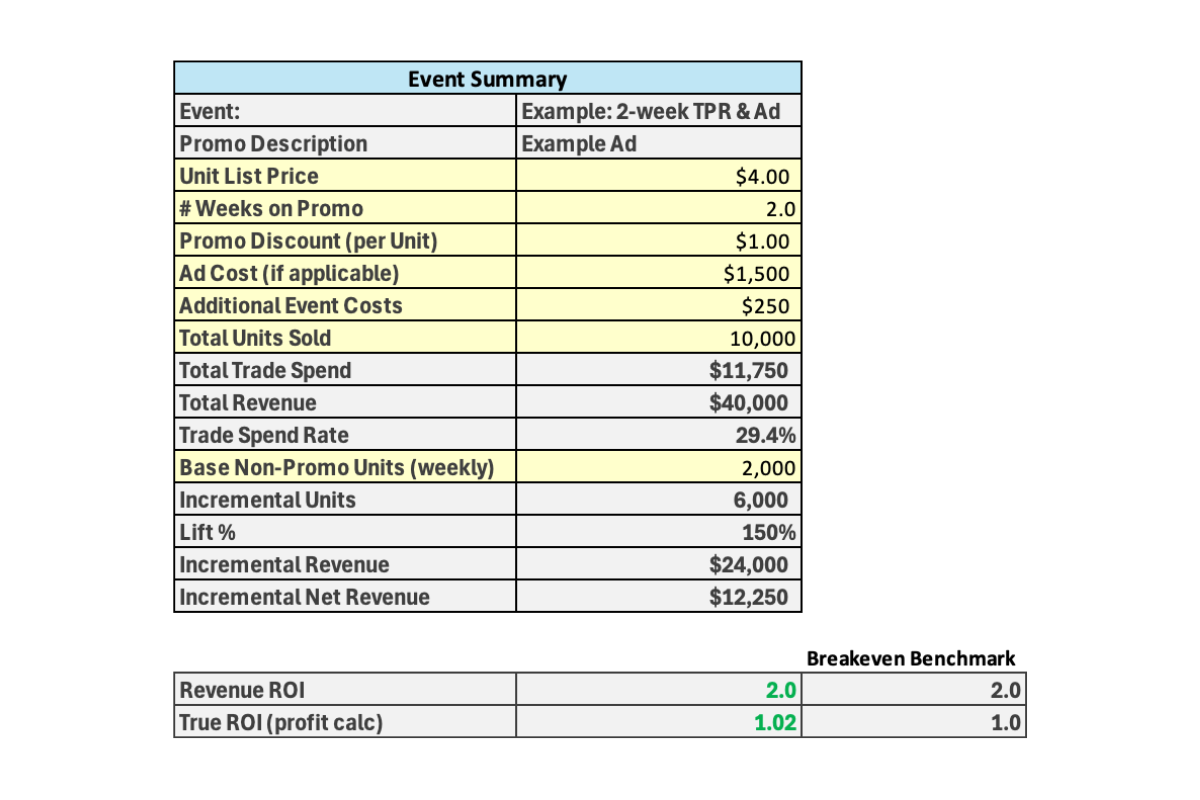
Now compare to a test with:
- A 2-week TPR
- Reduced ad fees
- More efficient spend and better timing
Here, the team negotiated a leaner event—cutting ad spend and shortening the window, knowing most lift happens early. It paid off: they drove $12,250 in incremental profit on just $11,750 of spend.
Why This Matters
These examples show why it’s critical to go beyond trade rate averages. Two events with the same discount structure produced very different financial outcomes. By tracking True ROI, you gain leverage to negotiate smarter events, eliminate waste, and spend with intent.
Want to try it for yourself?
Use the TrewUp True ROI Calculator to break down your next event and uncover what’s actually driving returns.